


Calgary Market Report
JANUARY 2023
JANUARY 2023
If you’re thinking about selling or buying a home, it's important to have a good understanding of what’s going on in the Calgary market.
Knowing the most important data such as the average sales price, number of homes sold, and days on market will better prepare you to sell your home or make an offer.
Our market report showcases everything you need to know about local real estate trends.
New Listings
Inventory
Total Sales
Benchmark Sales Price
Average Days on Market
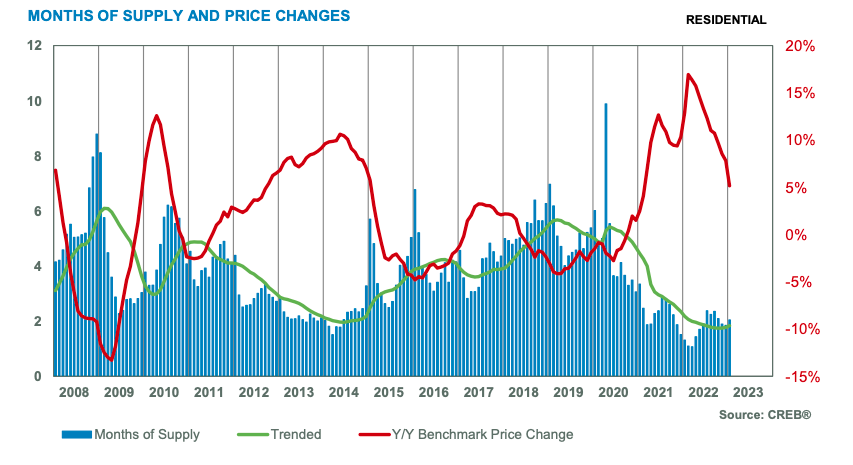
Months of Supply
Sale-to-List Price
City of Calgary, February 1, 2023 –
The level of new listings in January fell to the lowest levels seen since the late 90s. While new listings fell in nearly every price range, the pace of decline was higher for lower-priced properties.
At the same time, sales activity did slow compared to the high levels reported last year but remained consistent with long-term trends. However, there has been a shift in the composition of sales as detached homes only comprised 47 per cent of all sales.
“Higher lending rates are causing many buyers to seek out lower-priced products in our market,” said CREB® Chief Economist Ann-Marie Lurie. “However, the higher rates are likely also preventing some move-up activity in the market impacting supply growth for lower-priced homes. This is causing differing conditions in the housing market based on price range.”
With 2,451 units available in inventory, levels remain 43 per cent lower than long-term trends for the month. While overall inventory levels are slightly lower than last January, there is significant variation by price range. Homes priced under $500,000 reported year-over-year inventory declines of nearly 30 per cent while inventory levels improved for homes prices above that level.
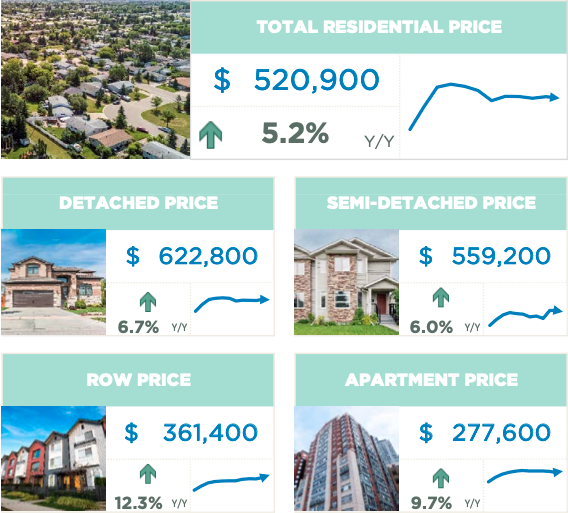
Although conditions are not as tight as last year, lower supply levels are preventing a significant shift toward balanced conditions and prices did trend up slightly over last month breaking the seven consecutive month slide. As of January, the benchmark price reached $520,900, 5 per cent higher than last January, but still well below the May 2022 high of $546,000.
Benchmark home prices reflect a typical home to ensure price movements better reflect market activity. Over time, the typical home evolves and the MLS® Home Price Index also evolves to ensure the data remains in line with modern housing trends. As of today, the benchmark price was recalculated based on a modern typical home. Details on the model adjustments can be found on the Canadian Real Estate Association’s website.
HOUSING MARKET FACTS
Detached
Detached home sales saw the largest pullback despite the year-over-year rise in inventory levels. Higher lending rates are cooling demand for higher-priced homes which is supporting inventory gains. Meanwhile, a limited supply of lower-priced products is preventing stronger sales in the lower price ranges.
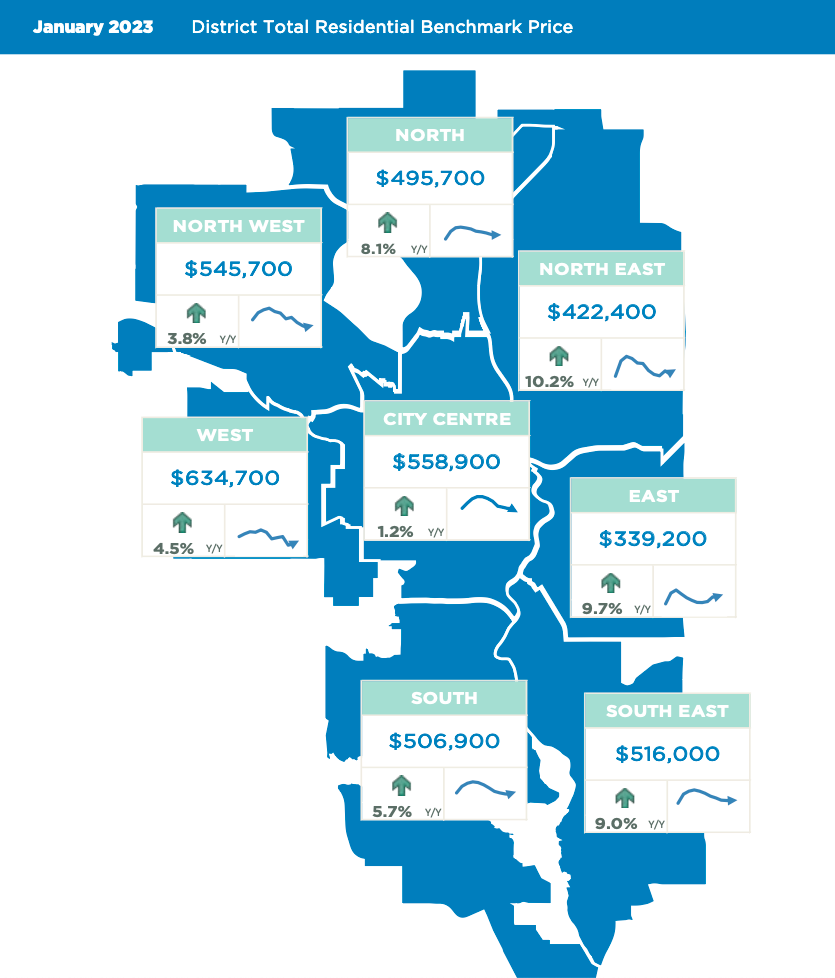
The variation within the market is likely causing divergent trends in pricing as prices have trended down in the higher-priced City Centre, while still reporting some modest gains in other districts of the city. Overall, the benchmark price reached $622,800 in January, slightly higher than levels reported in December, but still below the monthly high achieved in May 2022.
Semi-Detached
Sales in January slowed relative to last year’s levels but remained above levels achieved before the pandemic. At the same time, a pullback in new listings has left inventory levels below the already low levels reported last January. Like the detached sector, semi-detached homes have seen shifts where the demand remains strong for lower-priced product relative to the supply likely causing divergent trends in pricing.
In January, most districts reported a monthly benchmark price growth. However, prices did trend down in the higher-priced City Centre district causing Calgary’s semi-detached benchmark prices to ease slightly over levels seen in December 2022. Despite the monthly adjustment overall, prices remained nearly six per cent higher than levels reported in January 2022.
Row
Row homes sales slowed over last year’s record high but remained well above long-term trends for the month. Sales would have likely been stronger if more listings came onto the market. In January, new listings dropped over the previous year and were over 20 per cent below long-term trends. The adjustments in both sales and new listings did little to change the low inventory scenario and the months of supply remained below two months in January.
The persistently tight conditions did also prevent any downward pressure on prices which posted a nearly one per cent gain over December levels. With a benchmark price of $361,400, levels are still over 12 per cent higher than last January, and only slightly lower than the $363,700 monthly high achieved in June 2022.
Apartment Condominium
Sales for apartment condominiums did not see the same pace of decline as other property types in January partly due to the level of new listings coming onto the market. Nonetheless, inventory levels remained well below long-term trends for the month and have not been this low in January since 2014.
The adjustments to both sales and inventory have left this sector with a months of supply that is lower than levels seen at the start of 2022. The shift to affordable options is also impacting prices within the apartment condominium sector. In January, prices trended up from December levels driven by strong gains in the lower priced district of the North East and East. Overall, apartment condominium prices in the city reached $277,600, one per cent higher than last month and a year-over-year gain of nearly 10 per cent, narrowing the spread from the record high prices set in 2014.
(Source: CREB®)