


Calgary Market Report
JULY 2022
JULY 2022
If you’re thinking about selling or buying a home, it's important to have a good understanding of what’s going on in the Calgary market.
Knowing the most important data such as the average sales price, number of homes sold, and days on market will better prepare you to sell your home or make an offer.
Our market report showcases everything you need to know about local real estate trends.
New Listings
Inventory
Total Sales
Average Sales Price
Average Days on Market
Months of Supply
Sale-to-List Price
City of Calgary, August 2, 2022 –
Significant slowdowns in the detached and semi-detached market were nearly offset by sales growth in the apartment and row sectors. This left July sales three per cent lower than levels recorded last year. While this is the second month where sales activity has slowed, total residential sales this month are still amongst the strongest levels recorded in our market.
“Rising lending rates are causing shifts within the market and, as a result, new listings for higher-priced product are on the rise relative to sales activity,” said CREB® Chief Economist Ann-Marie Lurie.
“Meanwhile, there continues to be a lack of supply for lower-priced detached and semi-detached product. This is driving consumers who are looking for affordable homes to purchase apartment- and row-style properties.”
Residential new listings in the city declined compared to what was seen in 2021, but when considering the dynamics between price ranges, we are seeing a different trend play out. Listings for homes priced below $500,000 fell by 18 per cent, while levels rose by 20 per cent for homes priced above $500,000. This has left conditions to remain relatively tight in the lower-end of the market while conditions are shifting toward more balanced levels in the upper-end of the market.
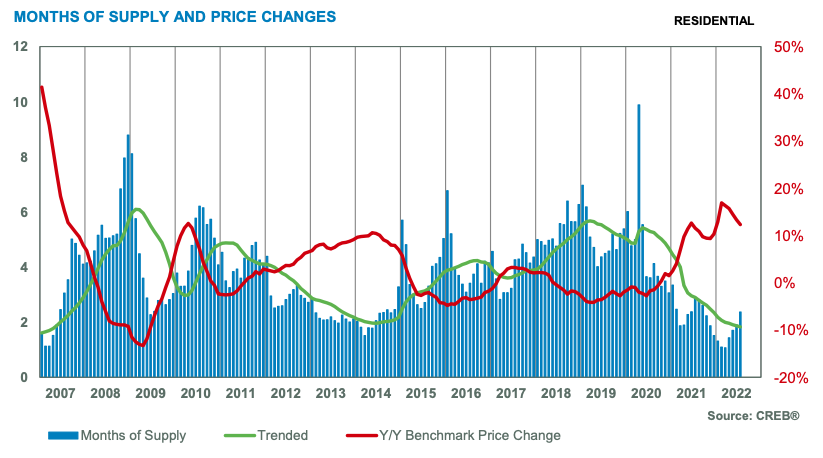
When considering the relationship between the supply and demand, the months of supply has continued to trend up from the exceptionally tight conditions seen earlier in the year. However, with just over two months of supply, the market remains far tighter than anything experienced throughout the recessionary period experienced prior to the pandemic.
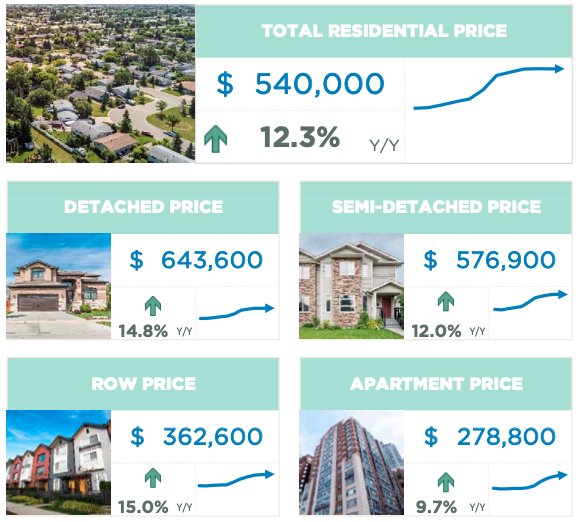
As expected, the benchmark price did see some slippage relative to levels seen earlier in the year and rising lending rates have cooled much of the bidding war activity that was driving significant gains earlier in the year. However, prices currently remain over 12 per cent higher than last year’s levels, still outpacing forecasted price growth for the year.
“As we move forward, we do anticipate further rate gains will weigh on housing activity and prices, but not enough to completely offset the exceptionally strong gains recorded over the first half of the year,” said CREB® Chief Economist Ann-Marie Lurie.
Benchmark home prices reflect a typical home to ensure price movements better reflect market activity. Over time, the typical home evolves and the MLS® Home Price Index also evolves to ensure the data remains in line with modern housing trends. As of today, the benchmark price was recalculated based on a modern typical home. Details on the model adjustments can be found on the Canadian Real Estate Association’s website.
HOUSING MARKET FACTS
Detached
In July, detached sales reached 1,136, which is 19 per cent lower than last year’s levels. Higher lending rates are driving more consumers to look for affordable product, however, the detached sector has struggled with supply levels for lower-priced homes. While we are seeing balanced conditions in the upper-end of the market, conditions remain exceptionally tight in the lower-end of the market.
The decline in sales was mostly driven by pullbacks in the lower-price ranges due to lack of availability. Nearly 80 per cent of the inventory available is priced over $500,000 and new listings for homes priced under $500,000 are half of the levels seen last year.
With a benchmark price of $643,600 in July, levels are still nearly 15 per cent higher than last year. However, we are seeing some monthly adjustments as prices trended down across all districts in July compared to last month.
Semi-Detached
For the third month in a row, semi-detached sales saw less sales than levels reported a year ago. While year-to-date sales remain over 11 per cent higher than last year’s levels, this is a significant shift from the 40 per cent growth recorded after the first quarter of the year. This pullback in sales was met with lower listings levels, but not enough to prevent some upward trend growth in inventory levels and the months of supply. The months of supply pushed up to 2.5 months in July, the first time it has pushed above two months since October of last year.
While conditions remain relatively tight in the lower-price ranges, the benchmark price did trend down relative to levels seen earlier in the year. However, like the detached market, prices remained significantly higher than levels reported last year.
Row
While levels cooled relative to the spring, row sales reached a new record high for July contributing to year-to-date sales growth of 54 per cent. Most of the gains were driven by product priced between $300,000 to $500,000, which also saw the biggest boost in new listings so far this year.
Both new listings and sales have trended down from levels seen earlier the year. However, the gap between sales and new listings narrowed over the past few months causing inventories to trend down compared to earlier in the year. This has ensured that the months of supply remained below two months. The persistently tight conditions prevented any significant adjustment in monthly prices in July.
Apartment Condominium
Like row properties, apartment condominium sales trended down from earlier in the year but maintained a record high level for July, contributing to a year-to-date gain of 66 per cent. Rising lending rates and available supply in the condominium sector helped support the year-over-year sales growth seen so far this year.
While trending down from earlier in the year, new listings in July remain 24 per cent higher than last year’s levels supporting a sales-to-new-listings ratio and a months of supply that reflect relatively balanced conditions. With conditions not as tight as earlier in the year, the pace of price growth has also slowed. In July, the benchmark price reached $278,800, slightly higher than last month and nearly 10 per cent higher than last year’s levels.
(Source: CREB®)