Calgary Market Report
JUNE 2021
JUNE 2021
If you’re thinking about selling your home, it's important to have a good understanding of what’s going on in the Calgary market.
Knowing the most important data such as the average sales price, number of homes sold, and days on market will better prepare you to sell your home.
Our market report showcases everything you need to know about local real estate trends.
Supply trends up but market still favours the seller
City of Calgary, July 2, 2021 –
Calgary’s housing market is showing few signs of letting up, as sales reached 2,915 units in June – a record high for the month.
“It is taking time for supply to catch up with the demand in the market,” said CREB® chief economist Ann-Marie Lurie.
“Through the early spring market, many buyers did not have a lot of choice, but the recent improvements in supply are providing more options for those purchasers and supporting the strong sales we continue to see in June. At the same time, gains in inventory are taking some pressure off the market as it starts to trend towards more balanced conditions.”
New listings in June totalled 4,135, the second-highest level ever recorded for the month. This caused inventories to trend up to 6,918 units. While this is higher than longer-term averages, it was balanced by strong sales and the months of supply remained relatively tight at 2.4 months. However, this is still an improvement from earlier in the year when the months of supply was below two.
As the market moves toward more balanced conditions, we are also starting to see the pace of price growth slow. The benchmark home price continued to trend up in June, but the monthly gain slowed to less than one per cent. While the pace of growth is slowing, as of June, the benchmark price was 11 per cent higher than levels recorded last year.
HOUSING MARKET FACTS
Detached
Despite some modest improvements in inventory levels, strong sales in June have kept the detached sector of the market firmly in sellers’ market conditions.
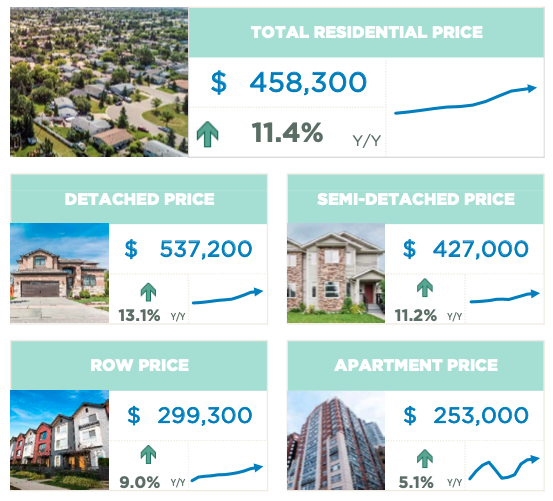
With a sales-to-new-listings ratio of 76 per cent and the months of supply below two months, benchmark home prices continue to rise. The unadjusted detached benchmark price totalled $537,200 in June, nearly one per cent higher than last month and 13 per cent higher than last year’s levels.
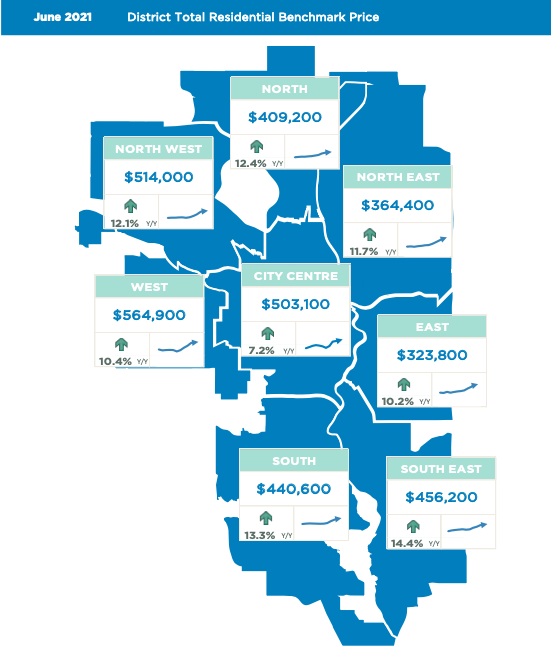
Despite the sellers’ market conditions in the detached sector, there is some variation depending on location. The districts with the strongest demand relative to supply are the North, North West, South, South East and East districts. Each of these districts has less than two months of supply in June, which is well below longer-term averages. The tightness in these areas has also resulted in the highest year-over-year price gains.
The City Centre has not experienced the same tight conditions as other districts and is the only district where detached prices have yet to recover from previous highs.
Semi-Detached
The pace of semi-detached sales growth is showing some signs of slowing, but year-to-date sales remain at record highs. New listings have also reached new highs so far this year. However, the growth in sales has outpaced the growth in new listings, preventing any significant shift in inventory levels.
With 592 units in inventory in June, levels have trended up from the start of the year. However, with the months of supply currently sitting at two-and-a-half months, conditions continue to favour the seller.
The persistent sellers’ market conditions have caused benchmark prices to trend up, reaching $427,000 in June. Gains have occurred across all districts so far this year, but the amount of growth has ranged from a low of less than five per cent to a high of nearly 10 per cent. Despite these gains, only the North, West and South East districts have seen prices recover to previous highs.
Row
After the first half of the year, row sales totalled 2,045, their highest mark since 2007. Those sales have been met with record-high new listings. This has caused inventories to trend up over recent months to levels higher than what we typically see at this time of year.
The higher inventories have not been a problem, as they’ve been balanced by strong sales. The month of supply remains below three months and this sector continues to favour the seller. Recent gains in the months of supply are helping the market move toward more balanced conditions, but it is too soon to see the shift impact pricing.
In June, citywide row prices totalled $299,300, one per cent higher than last month and nine per cent higher than last year’s levels. Prices have improved across most districts, but they remain well below previous highs.
Apartment Condominium
Recent price gains have encouraged more people to sell their condominiums this year, causing both new listings and overall inventories to increase relative to the previous year. At the same time, relative affordability has supported sales totals that have improved from the exceptionally low levels recorded over the previous six years.
The result has been inventories that remain elevated compared to historical levels, but strong sales have helped bring the months of supply down to levels more consistent with balanced market conditions.
The balanced conditions have been supporting some price recovery in the market. Prices have trended up over the first half of the year and on a year-to-date basis they currently sit nearly three per cent higher than last year.
Prices have risen across all districts, but the largest price gain occurred in the West district. However, overall, prices remain nearly 15 per cent below previous highs.


(Source: CREB®)
New Listings
Inventory
Total Sales
Average Sales Price
Average Days on Market
Months of Supply
Sale-to-List Price