Calgary Market Report
NOVEMBER 2022
NOVEMBER 2022
If you’re thinking about selling or buying a home, it's important to have a good understanding of what’s going on in the Calgary market.
Knowing the most important data such as the average sales price, number of homes sold, and days on market will better prepare you to sell your home or make an offer.
Our market report showcases everything you need to know about local real estate trends.
New Listings
Inventory
Total Sales
Benchmark Sales Price
Average Days on Market
Months of Supply
Sale-to-List Price
City of Calgary, December 1, 2022 –
Residential sales in the city slowed to 1,648 units, a year-over-year decline of 22 per cent, but 12 per cent above the 10-year average.
The pullback in sales over the past six months was not enough to erase gains from earlier in the year as year-to-date sales remain nearly 10 per cent above last year’s record high. The year-to-date sales growth has been driven by a surge in both apartment condominium and row sales.
“Easing sales have been driven mostly by declines in the detached sector of the market,” said CREB® Chief Economist Ann-Marie Lurie. “Higher lending rates are impacting purchasers buying power and limited supply choice in the lower price ranges of the detached market is likely causing many purchasers to place buying decisions on hold.”
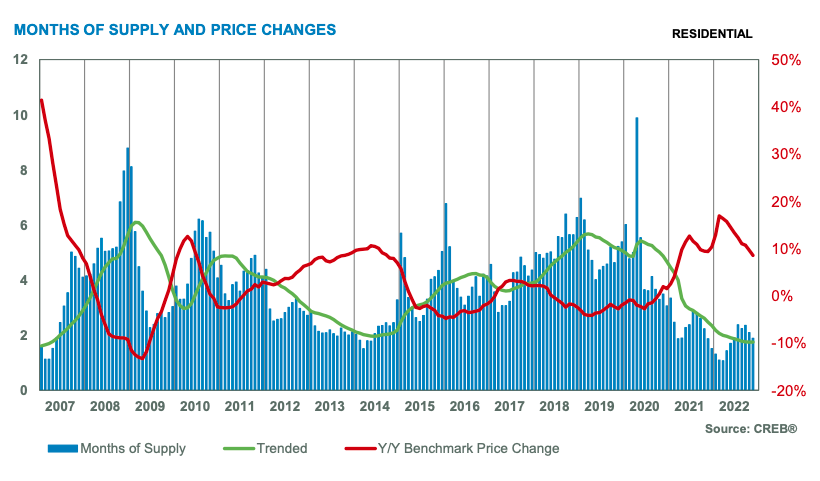
A decline in sales was met with a pullback in new listings and inventories fell to the lowest level reported in November since 2005. The pullback in both sales and new listings kept the months of supply relatively tight at below two months. The tightest conditions are occurring in the lower-price ranges as supply growth has mostly been driven by gains in the upper-end of the market.
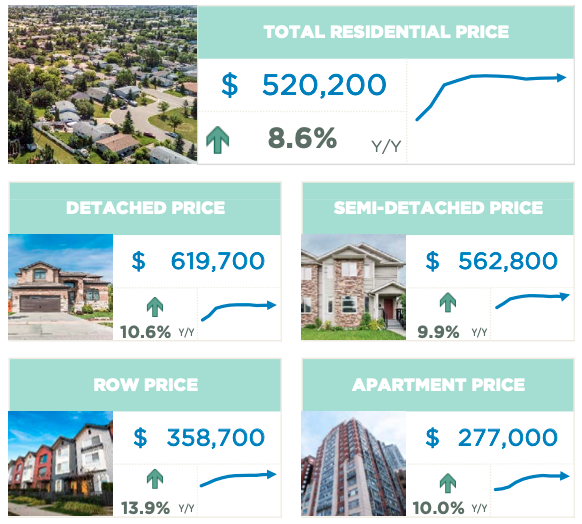
Despite the lower supply levels, prices have trended down from the peak reached in May of this year. Even with the adjustments that have occurred, November benchmark prices continue to remain nearly nine per cent higher than levels reported last year.
Benchmark home prices reflect a typical home to ensure price movements better reflect market activity. Over time, the typical home evolves and the MLS® Home Price Index also evolves to ensure the data remains in line with modern housing trends. As of today, the benchmark price was recalculated based on a modern typical home. Details on the model adjustments can be found on the Canadian Real Estate Association’s website.
HOUSING MARKET FACTS
Detached
Detached sales slowed across every price range this month, contributing to the year-over-year decline of nearly 34 per cent and the year-to-date decline of five per cent. On a year-to-date basis, sales have eased for homes priced under $500,000 as the level of new listings in this price range has dropped by over 36 per cent limiting the options for purchasers looking for affordable product.
Meanwhile, new listings and supply selection did improve for higher-priced properties creating more balanced conditions in the upper-end of the market. This has different implications on price pressure in the market.
The benchmark price in November slowed to $619,700, down from the high in May of $648,500. While prices have eased over the past several months, they continue to remain nearly 11 per cent higher than levels reported last year.
Semi-Detached
The pullback in sales this month was enough to cause the year-to-date sales to ease by nearly one per cent compared to last year. Despite the recent declines, year-to-date sales remain 37 per cent above long-term averages for the city.
Easing sales this month were also met with a pullback in new listings, causing further declines in inventory levels and ensuring market conditions remained relatively tight with a month of supply of two months and a sales-to-new-listings ratio of 100 per cent.
Unlike the detached sector, the tight conditions prevented any further retraction in prices this month. In November, the benchmark price reached $562,800, slightly higher than last month and nearly 10 per cent higher than last year’s levels.
Row
Further declines in new listings likely contributed to the slower sales activity this month as the sales-to-new-listings ratio remained high at 99 per cent. Inventory levels fell to 383 units, making it the lowest level of November inventory recorded since the 2013. This low level of inventory ensured that the months of supply remained below two months.
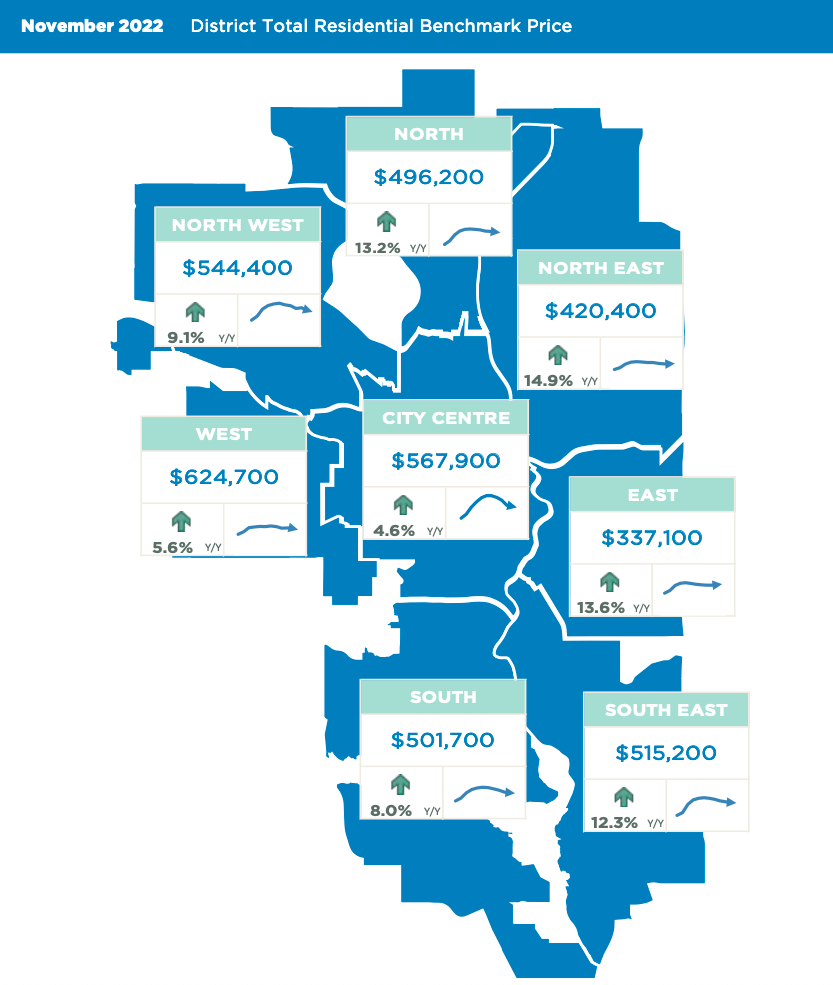
Despite the persistently tight market conditions, prices trended down this month reaching $358,700. While prices have eased from the June high, they are nearly 14 per cent higher than prices reported last November. The strongest price growth was reported in the North East, North and South East districts where prices have risen by over 18 per cent.
Apartment Condominium
Despite a pullback in new listings this month, apartment condominium sales continued to rise, and inventories fell to the lowest November levels seen since 2013. This caused further tightening in market conditions as the sales-to-new-listings ratio pushed above 100 per cent and a months of supply dropped to two months.
Recent tightening in the market has put a pause on price adjustments for apartment condominiums. In November, prices remained relatively stable at $277,000 compared to last month. While prices have reported a year-over-year gain of nearly 10 per cent, prices are still below their previous highs set back in 2014.


(Source: CREB®)